> ## Documentation Index
> Fetch the complete documentation index at: https://docs.sharethat.co/llms.txt
> Use this file to discover all available pages before exploring further.
# Analytics
> Understand how stats are calculated.
## Calculation Overview
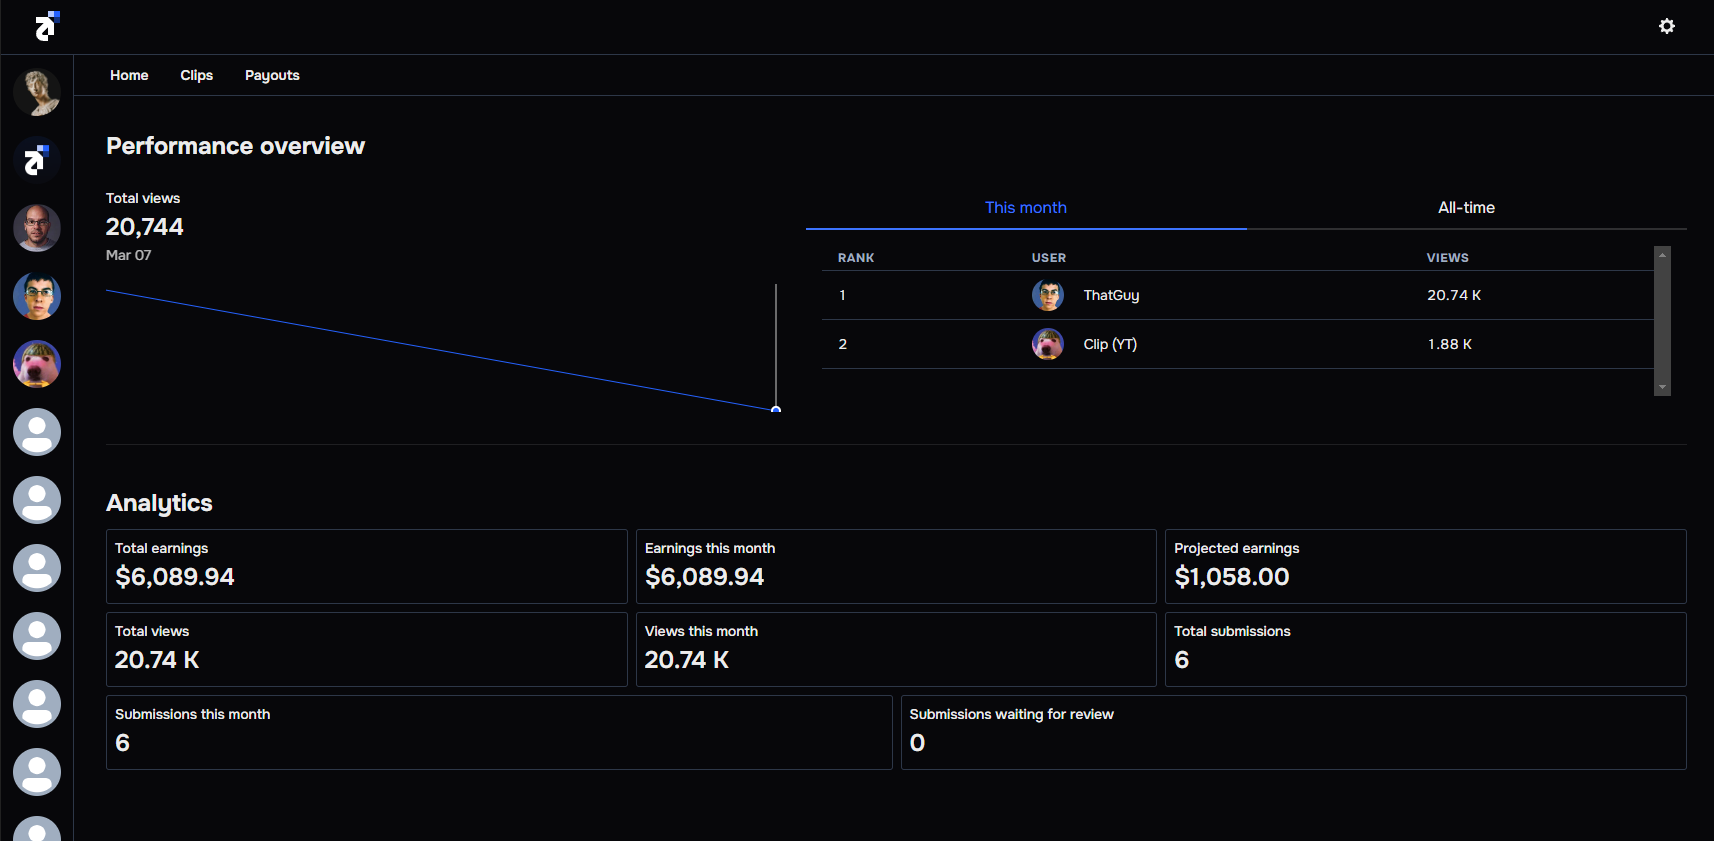 The view chart displays the number of views generated everyday over the last seven days.
The all-time total money you have been paid for submissions for the group.
The total money you can expect to be paid for currently active cycles when they end.
The all-time number of views that have been generated from submissions.
The number of views generated from submissions in the current month. This resets on the 1st of every month.
The all-time total number of clips submitted.
The total number of clips submitted in the current month. This resets on the 1st of every month.
The number of submissions that have been recently submitted and are pending.
The view chart displays the number of views generated everyday over the last seven days.
The all-time total money you have been paid for submissions for the group.
The total money you can expect to be paid for currently active cycles when they end.
The all-time number of views that have been generated from submissions.
The number of views generated from submissions in the current month. This resets on the 1st of every month.
The all-time total number of clips submitted.
The total number of clips submitted in the current month. This resets on the 1st of every month.
The number of submissions that have been recently submitted and are pending.